Evolution by continent:
Our curves are updated in real timeOur data come from Engineering (CSSE) at Johns Hopkins University (that collects all COVID19 data from all countries)
We compare the evolution of the number of COVID-19 deaths on the different continents: Asia, Africa, North America, South America and Europe
To can compare data from different continents (that are not populated in the same way), we have calculated the number of deaths per billion inhabitants
Oceania has been removed because the number of inhabitants is too small.

Evolution in the USA:
Our curves are updated in real timeOur data come from the Engineering department (CSSE) at Johns Hopkins University (that collects all COVID19 data from all countries)
Comparison USA - Mexico - Brazil:
Our graphs are updated in real timeOur data come from the Engineering department (CSSE) at Johns Hopkins University (that collects all COVID19 data from all countries)

Evolution in the United Kingdom:
Our curves are updated in real timeOur data come from the Engineering department (CSSE) at Johns Hopkins University (that collects all COVID19 data from all countries)
Comparison France - Italy - Spain:
Our graphs are updated in real timeOur data come from the Engineering department (CSSE) at Johns Hopkins University (that collects all COVID19 data from all countries)

Google Trends. Let‘s detect areas where the virus is circulating with the greatest intensity:
Even before contacting a doctor or taking a test, people who think they have COVID-19 search on google and learn about the different symptoms.It is therefore interesting to analyze some Google Keywords like for example "loss taste"
With a delay of 16 to 20 days, there is a correlation between the number of people who look up information on Google about the loss of taste and the number of deaths caused by covid.
Google Index is decreasing, since 2023 March !
So, the number of deaths, per day, in the USA is expected to decrease for the next few weeks.
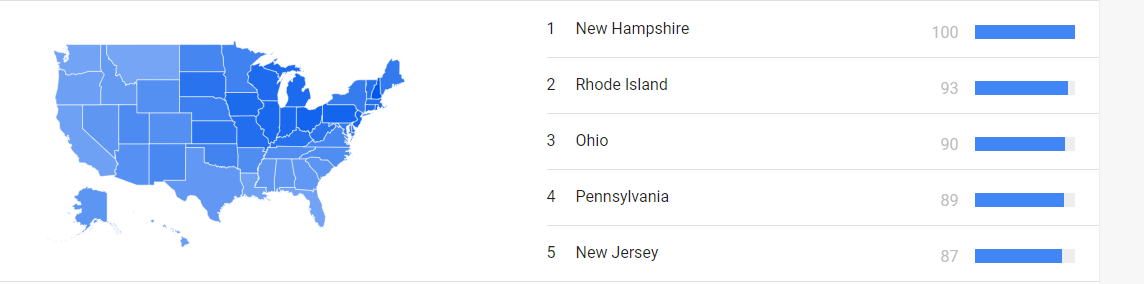
In which state is there currently the highest number of searches on the loss of taste ?
New Hampshire is currently the state with the highest number of searches (per inhabitant) about covid-19 symptom.
So, this is where the virus is circulating with the greatest intensity
In which counties are there currently the highest number of searches on the loss of taste ?
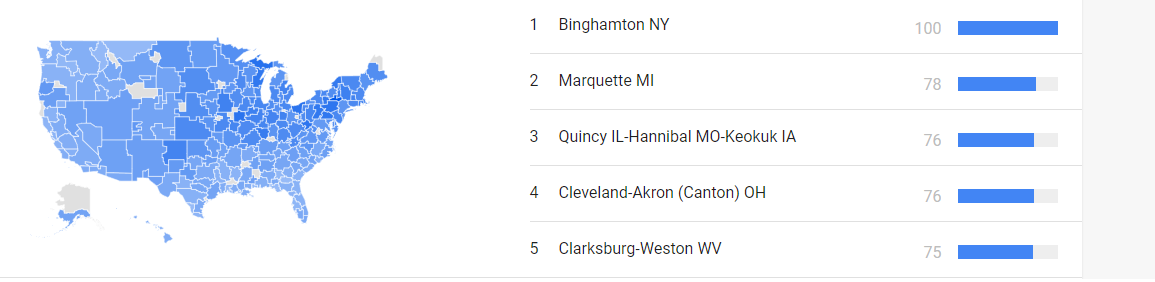
This list of states and this list of US-counties are updated in real time from Google Trends
Google Trends is a website by Google that analyzes the popularity of top search queries in Google Search across various regions
Google Trends normalizes search data to make comparisons between terms easier. Search results are normalized to the time and location of a query by the following process:
1) Each data point is divided by the total searches of the geography and time range it represents to compare relative popularity. Otherwise, places with the most search volume would always be ranked highest.
2) The resulting numbers are then scaled on a range of 0 to 100 based on a topic s proportion to all searches on all topics.
3) Different regions that show the same search interest for a term don't always have the same total search volumes.
Our Death Risk Comparison simulator for the USA:
Evolution in the World:
Our curves are updated in real timeOur data come from the Engineering department (CSSE) at Johns Hopkins University (that collects all COVID19 data from all countries)

English epidemiological study on COVID-19:
Here is the English epidemiological study on COVID-19, concerning 17 million medical files.For the first time, we have access to a strong estimation of the relative weights of different risk factors for death
The incredible finding of this study is that the weight of comorbidities is very low compared to age
A 45-year-old diabetic has 3 times less risk than a heathly 55-year-old
Age is by far the largest factor.
To simplify, we could almost say that it's the only factor that counts.
Our data sources:
https://www.atoute.org/n/IMG/pdf/fdrcoviduk.pdf?fbclid=IwAR0lhxtZFuQtlGcAW78fG8cq3gUjwg3RU4BjTrOXTDeno-ct84MpoCxaJSI

Correlation between the number of people who look up information on Google about the loss of taste and the number of people who are in intensive care.:
With a delay of 16 to 20 days, there is a correlation between the number of people who look up information on Google about the loss of taste and the number of people who are in intensive care.It's true in the USA with the English keywords "loss taste"

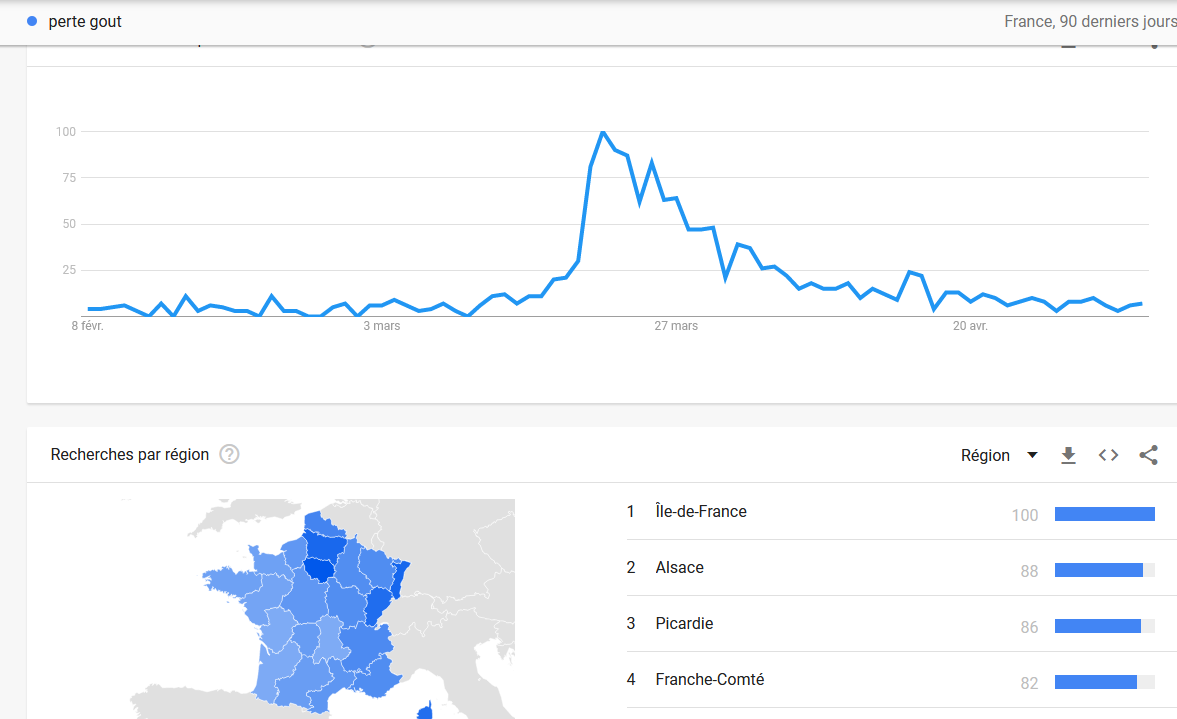
It's true in France with the French keywords "perte gout"
It's true in Italy with the Italien keywords "perdita gusto"
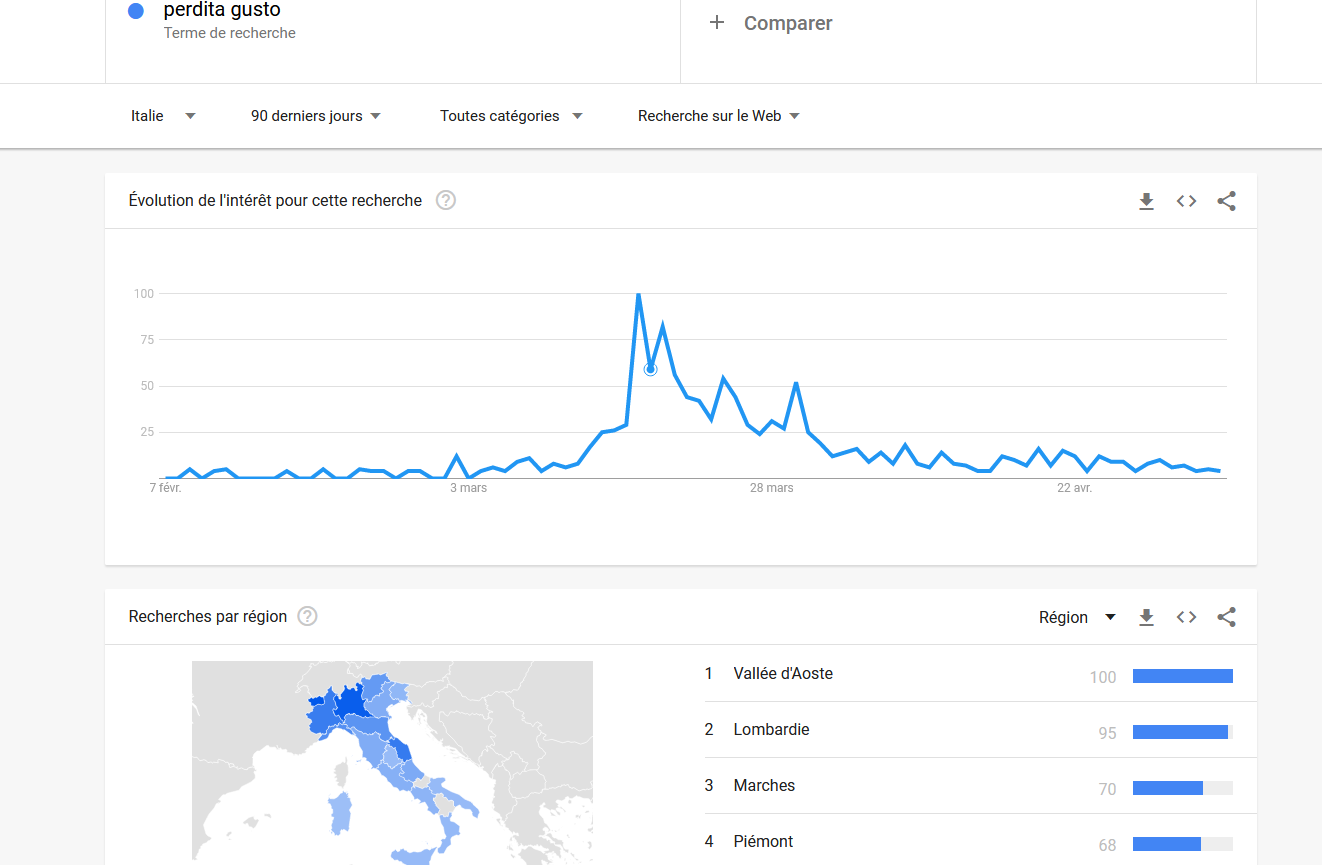
We will continue to follow the frequency of searches for these keywords because they could allow us to predict by several days in avance whether a second wave is likely, and if so, in what state
I would like to remind you that Google Trends is a website by Google that analyzes the popularity of top search queries in Google Search across various regions and languages. The website uses graphs to compare the search volume of different queries over time.
Speak with us on:
or in

Some correlations:
Countries are not infected in the same way by COVID-19Some countries have 0 deaths declared; in some other countries there are tens of thousands of deaths
Why such differences between countries ?
For each country, we have collected these DATA:
- number of inhabitants
- population density
- wealth by inhabitant
- average life span (from 52 years old in Angola to 84 years old in Japan)
- average age (from 16 years old in Chad to 43 years old in Italy or Japan)
- quality of health system
- freedom of the press (from 0 in North Korean to 77 in Sweden)
- temperature on average in 2020 April, in the biggest city of the country
- number of deaths (declared !), by million of inhabitants, from COVID-19
Let's analyze the correlation matrix
(A correlation matrix is a table showing correlation coefficients between variables. Each cell in the table shows the correlation between two variables. A correlation matrix is used to summarize data, as an input into a more advanced analysis, and as a diagnostic for advanced analyses. The value correlation ranges from -1 to +1. +1 describes a perfect positive correlation -1 describes a perfect negative correlation 0 means no linear correlation)
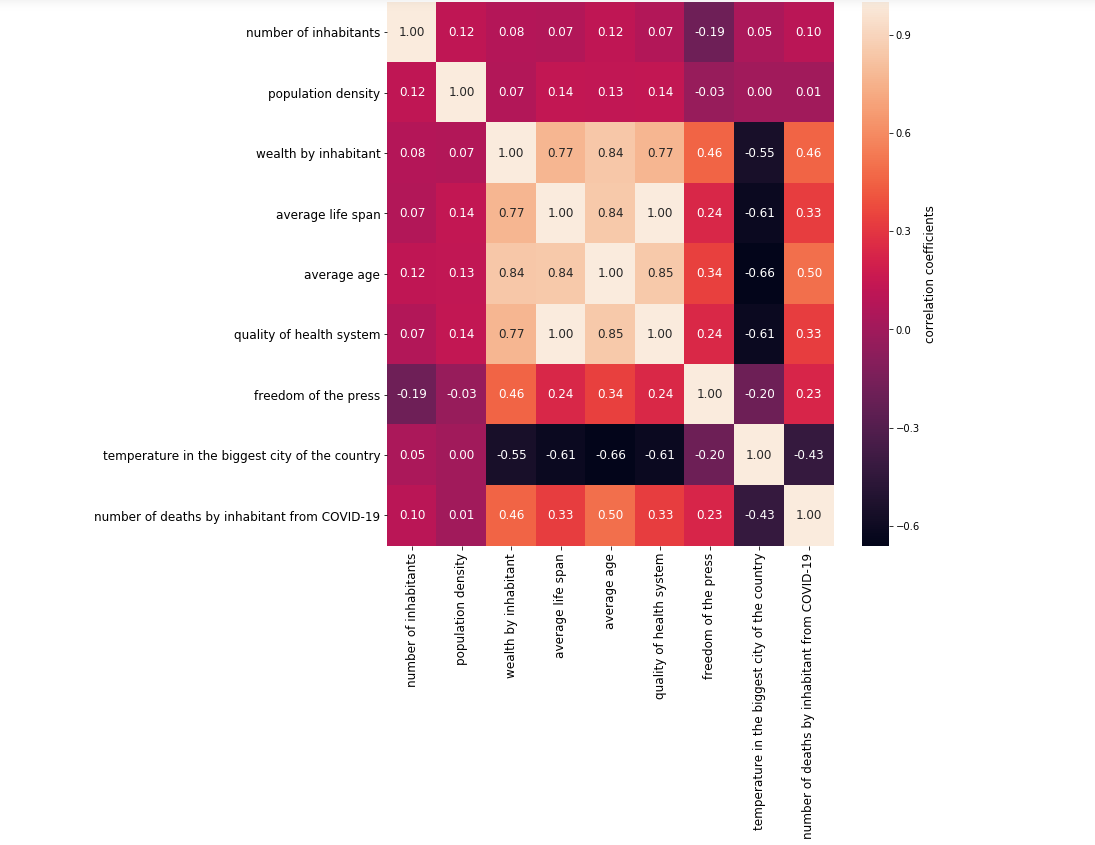
4 features are highly correlated: wealth by inhabitant, average life span, average age and quality of health system.
Indeed, in a prosperous country, people live a long time, the average age is high and the quality of the health system is better
The number of deaths declared by million of inhabitants is very correlated with these 4 features.
That may sound contradictory, but the better the quality of the health care system, the more deaths from Covid-19. It's a side effect.
A good health care system has a consequence a long life span and an high percentage of older population, who themselves have the consequence of an increased death rate from COVID-19
The freedom of press and the number of deaths from COVID-19 are positively correlated: the less freedom of the press, the lower the death rate declared
Temperatures and the wealth by inhabitant are negatively correlated: the poorer a country, the hotter its weather
Temperatures are also negatively correlated with the number of deaths
But beware: an effect is correlated to its cause but two effects will also be correlated between them
1) Does an increase in temperature reduce the number of deaths ?
2) Or are there fewer deaths in countries where it is hot because they are poor countries with a young population and a low life span ?
We cannot answer that question by only analysing our matrix of correlations.
We need to deepen our study: we have to train a machine learning algorithm
The gradient boosting algorithm is considered to be the most reliable machine learning algorithm with the best results
We have trained the algorithm with our dataset
The algorithm has given us the features it considered important to explain the differences in the number of COVID-19 deaths between countries.
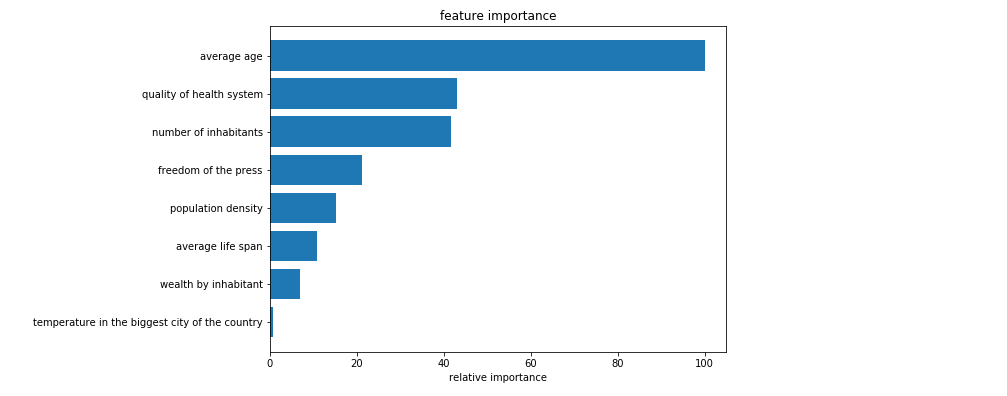
The most important of our variables is the average age of the population.
The temperature has virtually zero impact, and is not retained by the algorithm.
Conclusion: President Trump was wrong when he said that COVID-19 would disappear in the US with the rise in the temperatures and the arrival of spring and summer.
The temperature has no significant impact on the evolution of the pandemic. What a pity!
Our algorithm can be improved by adding other features to our dataset: we are going to do that to the next few days
We are interested in your comments (via Facebook or via Twitter)
Stay safe !
God bless America
Our data sources::
data about COVID-19: https://www.jhu.edu
freedom of the press : https://rsf.org/fr/classement
quality of health system: https://fr.april-international.com/fr/sante-des-expatries/quels-sont-les-pays-avec-les-meilleurs-systemes-de-sante
average life span: https://fr.wikipedia.org/wiki/Liste_des_pays_par_esp%C3%A9rance_de_vie
average age, by country: https://fr.wikipedia.org/wiki/Liste_des_pays_par_%C3%A2ge_m%C3%A9dian
wealth by inhabitant, by country: https://fr.wikipedia.org/wiki/Liste_des_pays_par_PIB_(PPA)_par_habitant
population density: https://fr.wikipedia.org/wiki/Liste_des_pays_par_densit%C3%A9_de_population
number of inhabitants: https://fr.wikipedia.org/wiki/Liste_des_pays_par_population
Temperature on 2020 April: https://fr.tutiempo.net/
Some correlations:
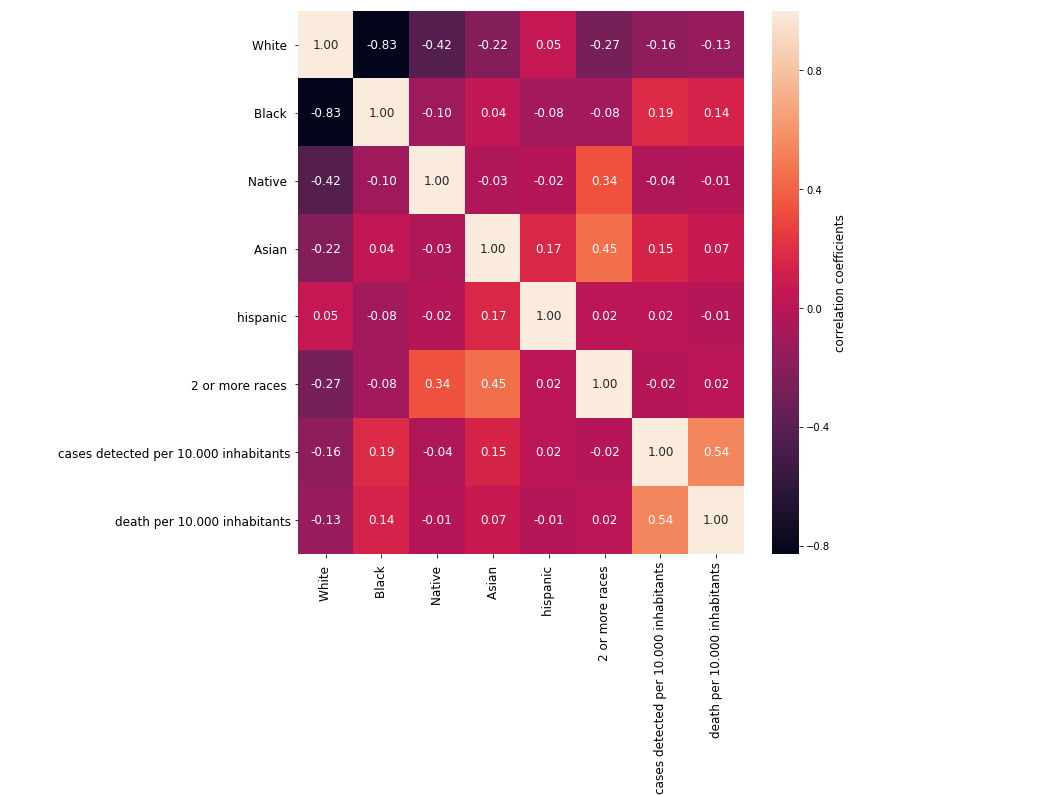
Who have the highest probability to be detected COVID-19 and to die of COVID-19 ?African American people are the most affected
Next come Asian
Then people of mixed raced
Then Hispanic people
Then Native Americans
Caucasian people are the less affected
We have built a correlation matrix heat map.
A correlation matrix is a table showing correlation coefficients between variables. Each cell in the table shows the correlation between two variables. A correlation matrix is used to summarize data, as an input into a more advanced analysis, and as a diagnostic for advanced analyses.
The value correlation ranges from -1 to +1.
+1 describes a perfect positive correlation
-1 describes a perfect negative correlation
0 means no correlation
Our data sources:
https://www.census.gov/library/publications/2011/compendia/usa-counties-2011.html?fbclid=IwAR298kYur4jeYdw4qmWgU0vfqq1AiOUCeh1t5f06kh2Gh-XJY36WsMV3nM0
https://docs.google.com/spreadsheets/d/1pxuTu10uO7MsBaKA554XSuCpnF--FTqwdnl_sUHfWro/edit?fbclid=IwAR0gfCEBDjKAQbi5ejlTU-tHsfpxdGIbnFZlFF9gTfDNvFYgUkGRmTmFUPU#gid=289496465
https://raw.githubusercontent.com/nytimes/covid-19-data/master/us-counties.csv?fbclid=IwAR3PUqAOnSRnKOrgBgwY3cNH8yQYWP64v7SoPVWvlL_FKFVbwe10rTiEhxw
What is the weather's impact on the evolution of the COVID-19 ? (1)
What is the weather's impact on the evolution of the COVID-19 ? The temperatures will be higher in May: will this reduce the epidemic ? At what temperature ?Does the percentage of humidity have an impact ?
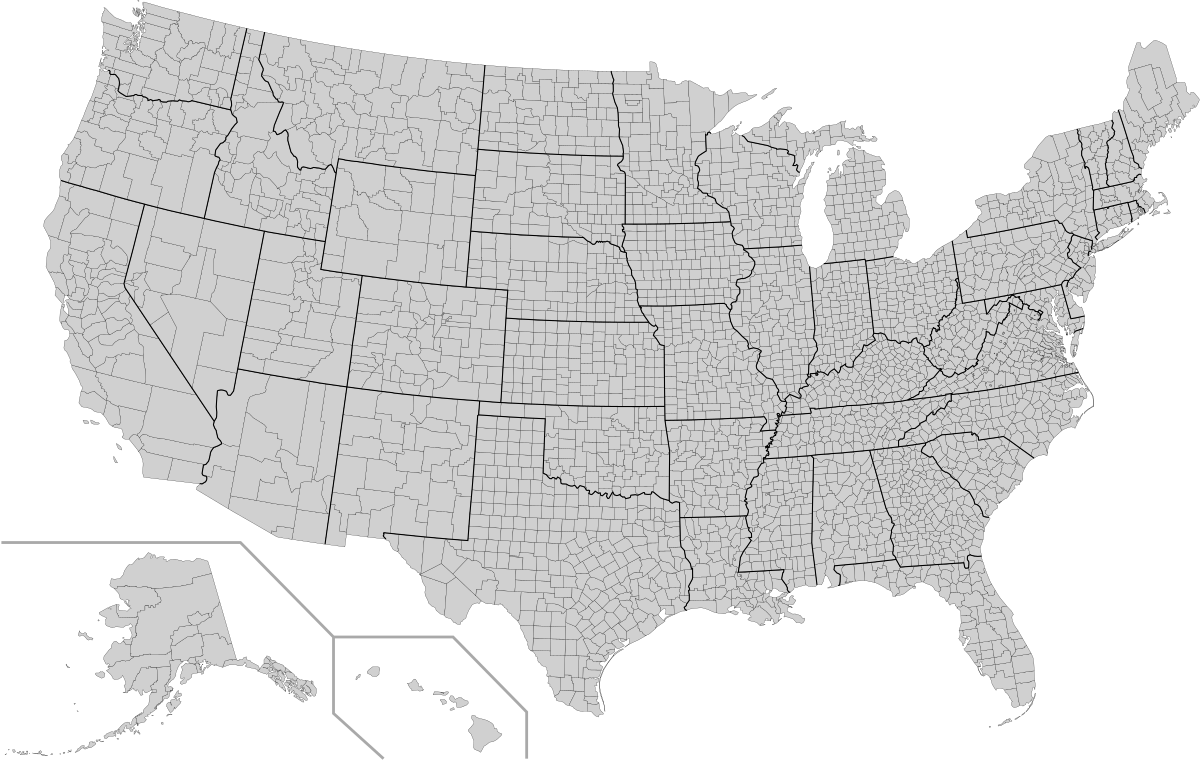
Now, we can give you the results of our study about the 3242 US-counties (see our post from yesterday)
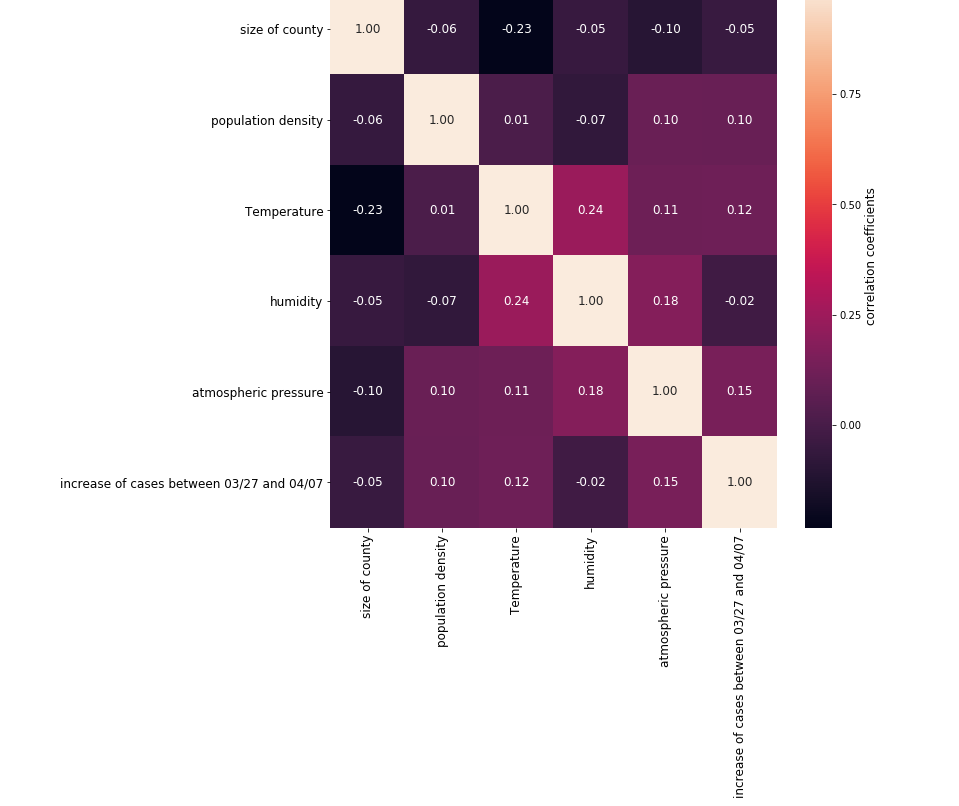
Bad news: there is no correlation between the temperature and the speed of evolution of the COVID-19.
The United States is a very large country. Currently a vast range of temperatures can be found there: betwwen 20 F and 90 F
It's the same thing for the humidity and atmospheric pressure: there is no correlation
We have built a correlation matrix heat map: the correlation coefficients between weather and evolution of the epidemic are insignificant
What is the weather's impact on the evolution of the COVID-19 ? (2)
What is the weather's impact on the evolution of the COVID-19 ? The temperatures will be higher in May: will this reduce the epidemic ? At what temperature ? Does the percentage of humidity have an impact ?We are going to try to answer these questions in the next few days.
For each of the 3242 counties in the US, we have collected data on:
- number of inhabitants
- area
- density of population
- distribution by age group
- percentage of graduates
- containment index through Google Mobility
- mean of temperature in March 2020
- mean of percentage of humidity in March 2020
- evolution of epidemic: number of cases and number of deaths
We have just finished the step of data collection and data cleaning.
Next step: to train our algorithms on our data sets.
The objective is to identify the features which are important and which have an impact on the evolution of the epidemic.
We will be careful of biases.
Our data sources:
https://www.census.gov/library/publications/2011/compendia/usa-counties-2011.html?fbclid=IwAR298kYur4jeYdw4qmWgU0vfqq1AiOUCeh1t5f06kh2Gh-XJY36WsMV3nM0
https://docs.google.com/spreadsheets/d/1pxuTu10uO7MsBaKA554XSuCpnF--FTqwdnl_sUHfWro/edit?fbclid=IwAR0gfCEBDjKAQbi5ejlTU-tHsfpxdGIbnFZlFF9gTfDNvFYgUkGRmTmFUPU#gid=289496465
https://www.timeanddate.com/weather/@5075315/historic?month=3&year=2020&fbclid=IwAR2kI5HJbghOtpvafcpl9FCE430_nLc_aWQYVjNyWrIPESaFSucU8yA3UXo
https://raw.githubusercontent.com/nytimes/covid-19-data/master/us-counties.csv?fbclid=IwAR3PUqAOnSRnKOrgBgwY3cNH8yQYWP64v7SoPVWvlL_FKFVbwe10rTiEhxw
Google Mobility:
Google is giving the world a clearer glimpse of exactly how much it knows about people everywhere:using the coronavirus crisis as an opportunity to repackage its persistent tracking of where users go and what they do as a public good in the midst of a pandemic.
The reports consist of per country, or per state, further broken down into regions/counties: with Google offering an analysis of how community mobility has changed vs a baseline average before COVID-19 arrived to change everything.
Google location mobility report for Italy, which remains the European country hardest hit by the virus, illustrates the extent of the change from lockdown measures applied to the population — with retail & recreation dropping 94% vs Google’s baseline; grocery & pharmacy down 85%; and a 90% drop in trips to parks and beaches.
In our graph, we have analyzed the evolution of trips to parks and beaches.
google data: https://www.google.com/covid19/mobility/

Speak with us on: